Indian Logistics Platforms Use AI to Predict Cross-Border Delay Risk
Freight platforms are combining port schedules, carrier milestones, weather, and customs events to estimate which shipments are most likely to miss planned handoffs.
SYNTHETIC EDITORIAL QA FIXTURE - not real reporting
Key takeaways
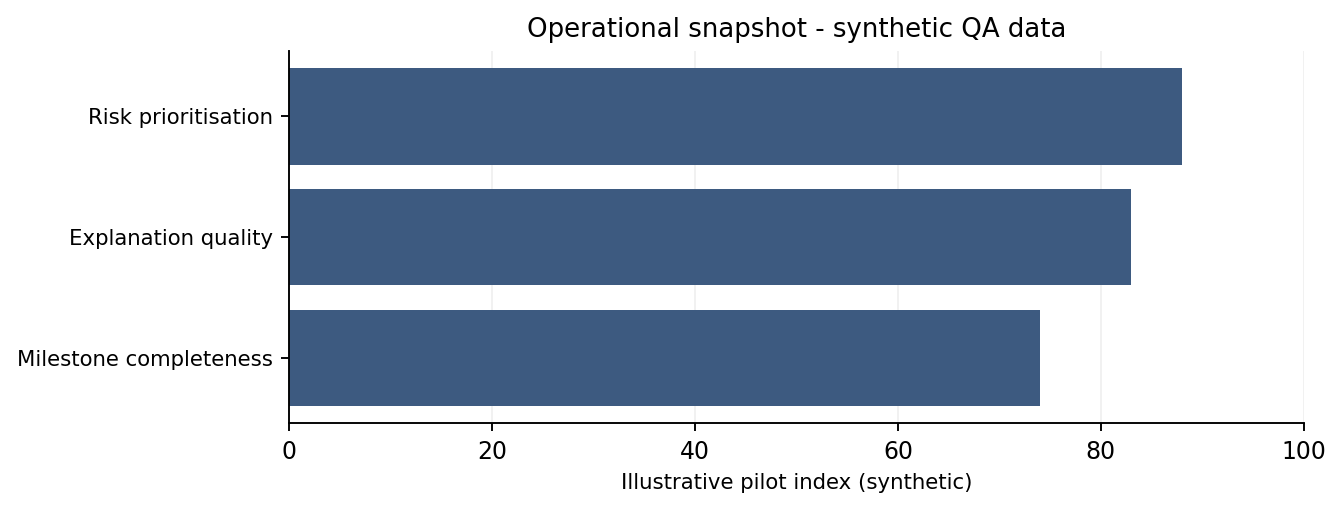
Risk scoring is shifting attention from every shipment to the few that need intervention.
Teams are evaluating whether explanations are specific enough for operators to act on.
Prediction quality depends heavily on consistent milestone data across carriers and borders.
“Operations teams do not need another red icon. They need to know what is likely to happen, why, and what action is still available.”
Risk scoring narrows the queue
Regional freight teams can oversee thousands of shipments at once, making it difficult to investigate every minor schedule change. Predictive systems rank shipments by likely service impact so operators can focus on the most consequential exceptions.
Explanations guide intervention
Useful alerts identify the events that drove the score, such as a delayed vessel departure, a missed customs milestone, or a weather disruption at a transshipment port. That context helps teams decide whether to reroute, expedite documents, or notify customers.
Milestone quality remains uneven
Data quality still varies widely between carriers and trade lanes. Platforms are investing in normalization and confidence scoring so missing events do not create false precision.
Operational feedback improves the model
As operators confirm which alerts led to real disruptions, those outcomes can improve future models. The loop between prediction and intervention may become more valuable than a static dashboard.
Synthetic data snapshot
| QA metric | Before / baseline | Pilot / after | Interpretation |
|---|---|---|---|
| Shipments manually reviewed | 100% | 34% | More focused operations |
| High-risk alert precision | 61% | 82% | Fewer false alarms |
| Average exception lead time | 7.4 hr | 13.1 hr | Earlier intervention |
QA note: All organizations, metrics, quotations, people, and scenarios in this file are synthetic and created only to test editorial import, taxonomy mapping, rich-text preservation, images, charts, tables, quote handling, and article workflow behavior.